How much greenhouse gas comes from food?
 How much does the US food system contribute to greenhouse gas emissions?
Perhaps the most widely-circulated estimate comes from Michael Pollan’s open letter to the presidential candidates, published in the New York Times last October under the title Farmer in Chief. As soon as the letter was published it started spreading through email and the blogosphere. At least four of the conferences I have attended since then have included it among the conference handouts. Here’s what it said:
After cars, the food system uses more fossil fuel than any other sector of the economy — 19 percent. And while the experts disagree about the exact amount, the way we feed ourselves contributes more greenhouse gases to the atmosphere than anything else we do — as much as 37 percent, according to one study.
That’s a lot of energy and greenhouse gas. But are Pollan’s numbers credible?
I don’t think so.
According to an energy analysis conducted at Iowa State University, US farms consumed about 1.8 exajoules in 2002 — about 1.7% of the nation’s total energy.
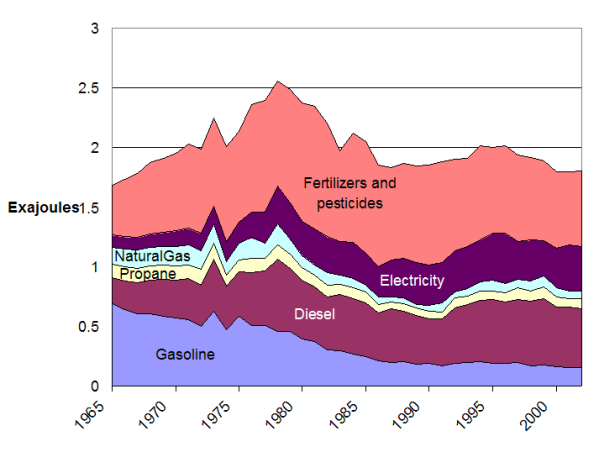
Direct and indirect energy use by U.S. farms, 1965-2002. (Adapted from Miranowski 2004)
Farming accounts for about a fifth (~20%) of the energy used to get food to our plates, according to a University of Michigan study.
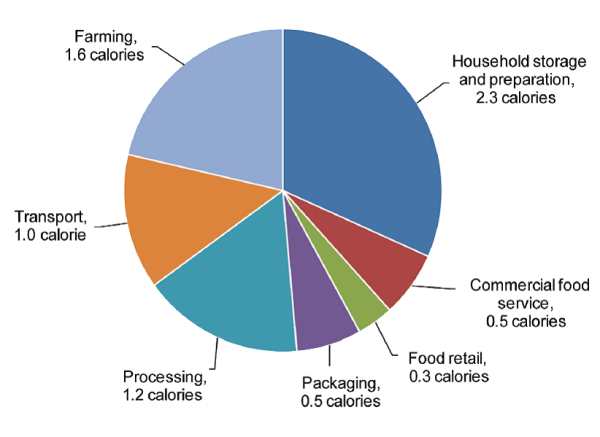
Energy expended in producing and delivering one food calorie in the U.S. (Figure from Heinberg and Bomford 2009, adapted from Heller and Keoleian 2000)
I did some complex mathematics (i.e. multiplied 1.7 by 5) to estimate that the food system accounts for about 9% of the energy consumed in the U.S.
The nice thing about this back-of-the-envelope estimate is that it agrees with another approach to estimating food system energy consumption. The graph above shows the food system using 7.3 calories to deliver each calorie of food consumed by Americans. I multiplied this factor (7.3) by the average per capita calorie consumption in the U.S. (2,775 kcal/day), the number of days in a year (365), and the number of people in the country (307 million). That comes to 9.5 exajoules (let Google do the math), or about 9% of the energy consumed in the U.S.
My estimate is about half of Pollan’s. If the food system really used 19% of the energy consumed in the U.S. — as Pollan says — then every calorie we consume would take about 15 calories to get to our plate (let Google do the math). That’s twice as much as the University of Michigan estimate, and 50% more than Pollan himself claims later in the same paragraph:
The 20th-century industrialization of agriculture has increased the amount of greenhouse gases emitted by the food system by an order of magnitude; chemical fertilizers (made from natural gas), pesticides (made from petroleum), farm machinery, modern food processing and packaging and transportation have together transformed a system that in 1940 produced 2.3 calories of food energy for every calorie of fossil-fuel energy it used into one that now takes 10 calories of fossil-fuel energy to produce a single calorie of modern supermarket food.
A greenhouse gas inventory released by the US-EPA yesterday shows that energy use accounts for the vast majority of emissions.
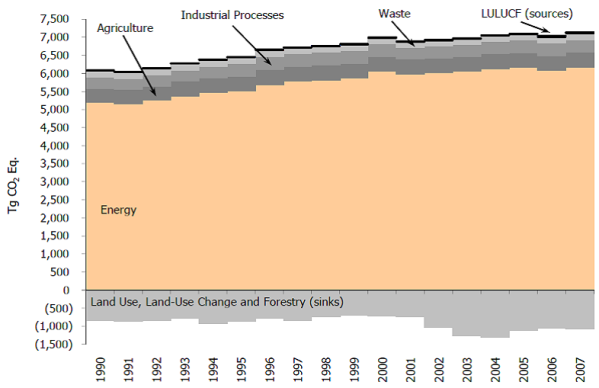
U.S. Greenhouse Gas Emissions and Sinks by Sector, 1990-2007 (US-EPA 2009)
Farming generates additional emissions associated with land use practices, manure management, ruminant digestion, residue burning and other agricultural practices. These account for about 6% of US emissions. (The dark grey zone in the graph above is broken down for 2007 in the graph below).
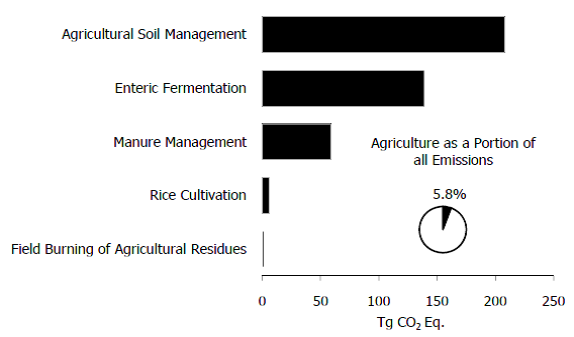
U.S. Agricultural Greenhouse Gas Sources, 2007. (US-EPA 2009)
If food system energy use makes up ~9% of U.S. greenhouse gas emissions, and agricultural practices not associated with energy use make up ~6%, then the food system is responsible for about 15% of emissions. That’s a far cry from 37%, but it’s still a lot of greenhouse gas.
Each year, Americans emit almost 20 tonnes of carbon dioxide equivalents per person. If 37% of that went to the food system then simply feeding each American would release the equivalent of 7.2 tonnes of carbon dioxide — more than a typical person in Sweden or France emits in a year, and more than 70% of the amount emitted by somebody in the United Kingdom. That seems improbable.

National carbon dioxide (CO2) emissions per capita. Shows various countries and their levels of CO2 emissions per capita. Also indicates the difference from high income to low income nations on CO2 output (World Bank 2004).
Analyses conducted in Sweden, France, and Britain show that these countries also have energy and greenhouse gas-intensive food systems, not unlike the US. A British study, for example, attributed 19% of the country’s greenhouse gas emissions to the food system:
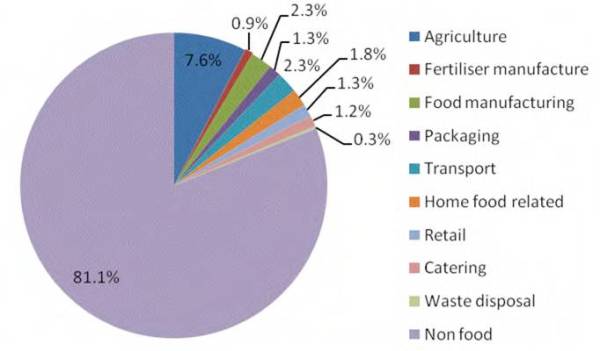
Overall food related greenhouse gas emissions in the United Kingdom (Garnett, 2008, Cooking Up A Storm)
Since per capita greenhouse gas emissions in the UK are approximately half that of the US, it follows that the UK food system would release a larger proportion of greenhouse gas than the US food system, even if the UK system is somewhat more efficient. I find it interesting that agriculture accounts for about 40% of food system emissions in the UK study, but only 20% in the US study.
My rough approaches to estimating US food system energy and greenhouse gas emissions suggest that the food system accounts for about 9% of US energy use and 15% of greenhouse gas emissions.
I agree wholeheartedly with Pollan’s message that our energy-intensive food system needs to be restructured, but I think that his numbers are off by a factor of two or more.


Thank you Michael for your fantastic work. I still have a difficult time re-conciliating all the numbers though. For example when the EPA charts US GHG emissions it shows electricity generation, transportation and industry as separate categories and then shows agricultural commercial and residential.
Do agricultural, commercial and residential activities not consume electricity and transportation? Is industry not a commercial activity? Does the GHG produced by the manufacture of farm equipment fall under industry or agriculture? What about the steel mill that produces the materials that go into the farm equipment or the electricity that runs the electric arc furnace in the steel mill?
How do we account for the supply chain when calculating the carbon footprint to any sector? If an activity drives demand or inversely if the cessation of an activity eliminates demand for such a supply chain is it not logical to attribute the impact to the end product that creates this demand?
Your thoughts would be most appreciated.
Pretty section of content. I just stumbled upon your weblog
and in accession capital to assert that I get actually enjoyed account your blog posts.
Any way I will be subscribing to your augment and even I
achievement you access consistently quickly.
This discussion is very interesting. Did Pollan ever explain where his numbers came from? Did you perhaps ask him? I respect Pollan greatly but if these numbers come out of thin air, it will be difficult to trust any of his factual claims.
Not that it makes a big difference to your argument, but adding up the Heinberg and Bomford 2009 pie chart segments above, I get 7.4 calories not 7.3 calories.
But maybe my math is wrong.
Your math is fine. All of the figures are rounded to the nearest tenth. The difference between the 7.3 calories reported by Heller and Keoleian and the 7.4 calories that you got by adding up the pie slices is simply due to rounding error.
Thank you for this information, Michael. I’m no statistician but am interested to know how does the report “Livestock and Climate Change” by Robert Goodland and Jeff Anhang fit with your findings? “….livestock and their byproducts actually account for at least 32.6 billion tons of carbon dioxide per year, or 51 percent of annual worldwide GHG emissions.” http://www.worldwatch.org/node/6294
This blog post looks at greenhouse gas emissions from the US food system, and the report you cite looks at greenhouse gas emissions from global livestock production.
I read the “Livestock and Climate Change” report soon after it was issued, and was disappointed by several conclusions that appear to be based on flawed assumptions and faulty logic. This surprised me, because I am usually impressed with articles from Worldwatch. “Livestock and Climate Change” is a response to a UN Food and Agriculture Organization (FAO) report called “Livestock’s Long Shadow” which estimates that livestock are responsible for 18% of global greenhouse gas emissions. The FAO didn’t soft-pedal livestock’s impact, concluding that livestock account for about a third of global methane emssions and two-thirds of nitrous oxide emissions.
The Worldwatch report includes animal respiration as a source of carbon dioxide emissions, but the FAO report does not. I tend to agree with the logic of the FAO that respiration is not a net source of CO2. The Worldwatch report’s claim that “a molecule of CO2 exhaled by livestock is no more natural than one from an auto tailpipe” appears to ignore the fact that livestock eat plants and automobiles consume fossil fuels.
The Worldwatch report misinterprets a questionable conclusion by British physicist Alan Calverd that 21% of CO2-producing power consumption involves keeping farm animals. This gets turned into a claim that livestock respiration accounts for 21% of human CO2 emissions.
I think that the Worldwatch report’s argument that the FAO’s analysis of carbon release from land clearing for livestock should include foregone greenhouse gas reductions is equally suspect. When I calculate how much I spend each month should I include all of the money that I didn’t make? An economist might argue that I should, and call the foregone income “opportunity cost,” but that doesn’t help with my budgeting. If we’re making claims about greenhouse gas emissions I think we should stick to actual emissions.
The most interesting thing about the Worldwatch report is its discussion of methane. Whether we choose to look at the global warming potential of methane over a 20 or 100 year timeframe is a political question with enormous implications. On a 20 year timeframe the apparent potency of methane triples. Livestock are the single biggest contributor to anthropogenic methane, and atmospheric methane is up by 150% since pre-industrial times whereas CO2 is only up 31%. (But atmospheric methane concentration is leveling off while CO2 concentration continues to rise).
It’s a bit fishy to use the 20 year multiplier for livestock emissions and not for other methane emissions, especially when stating livestock emissions as a proportion of greenhouse gas emissions. Still, the methane issue is worth delving into. I think the World Watch report would have been much stronger if it had stuck with methane and avoided the other arguments, which are too-easily dismissed.
The Worldwatch report may be correct in claiming that the FAO underestimated livestock contributions to greenhouse gas emissions, but I think that its own estimate is far less credible than the FAO’s.
I was wondering how much energy the average farm consumes.
There are just over 2 million farms in the US, and they use about 2 Exajoules of energy. Therefore, the average farm uses 1 Terajoule (1 billion BTU) per year.
I was wondering if you know what percentage of GHG emissions come from the transport and distribution of food. If you have a source, that’s even better. Thank you for your consideration.
Sincerely,
Steve Fisher
Weber and Matthews (2008) conclude that food transportation and delivery account for 11% of total GHG emissions from the U.S. food system, and wholesaling and retailing of food account for another 5%. Food production accounts for the vast majority (83%) of total food system emissions, according to their study. Their study does not account for emissions from household storage and preparation, which Heller and Keoleian (2000) found to be the single biggest contributor to energy use in the US food system.
Another interesting, if dated, reference is Hendrickson’s Energy Use in the US Food System: A Summary of Existing Research and Analysis. He reviews studies based on data from the 1940s through 70s. The various estimates of food system energy use range from 12 to 17% of US energy use. My hunch is that food system energy use has not grown as rapidly as total energy use in the US, so I expect that similar studies based on recent data would find a slightly lower proportion of our energy use goes to food today.
My hunch turned out to be wrong, according to a study released by the USDA’s Economic Research Service in March 2010. Food system energy use grew by 22.4% between 1997 and 2002, while energy use in the entire USA grew by just 3.3%. See my blog post on the study. This analysis suggests that food system energy use accounts for about 12% of energy use in the US — more than my previous estimates, but still well below Pollan’s.
I just received a link to a ‘Science Brief’ discussing ongoing work at UC Davis examining energy and greenhouse gas emissions by the US food system.
According to this group, about 15% of US energy usage and greenhouse-gas emissions is related to the food system. Of course I’m pleased to see that this number meshes with my estimate. I think it’s unlikely that energy use and greenhouse-gas emissions of the food system are both about 15%, though, because agriculture is responsible for a bunch of emissions that are not related to energy use. I suspect the proportion of greenhouse gas emissions from the food system will always be a little higher than the proportion of energy use.