Farm Scale Study: Results from 2009 field season

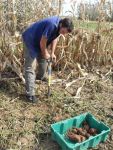
Soybean harvest, August 25, 2009
Part of the reason for blogging about our farm scale study is my belief that data should be openly accessible. I wanted to post results as we collected the information, to make the study available for continuous review by anybody interested in the project.
My idealism has fallen prey to time constraints. Instead of posting each new chunk of data as the growing season progressed, I am finally posting a season summary now that the 2009 harvest is stored and snow is on the ground.
As in 2008, we grew corn, soybean, sweet potato, and sweet sorghum organically at three different farming scales:
- Biointensive plots were managed according to methods recommended by John Jeavons, in his book How to Grow More Vegetables…, using only human labor and hand tools. Each biointensive plot covered 20 m2 (215 sq. ft.).
- Market garden plots were managed with hand tools and walk-behind tractors. Each market garden plot covered 126 m2 (1356 sq. ft.).
- Small farm plots were managed primarily with conventional 4-wheeled tractors, supplemented with hand tools and walk-behind tractors for tasks that weren’t suited to the larger machines. Each small farm plot covered 836 m2 (9000 sq. ft.)
Conducting the study took less time and energy in 2009 than in 2008. The combined research plots cover almost 4,000 m2 (~1 acre). In 2009 we used 166 hours of labor and 61 L (16 gal) of fuel to conduct the study. That compares with 311 hours and 72 L (19 gal) to conduct the same study in 2008. Perhaps we learned something between years.
In 2009 the biointensive and market garden scale plots out-yielded the small farm plots. Most of this difference was due to sweet sorghum, which did much better in the smaller scale systems in 2009. Sweetpotato yields were lower in 2009 than in 2008 at all scales. Other crops had similar yields between years at the small farm scale, but superior yields in 2009 at the biointensive and market garden scales. The 2009 trend toward higher yields at smaller scales was the opposite of the trend observed in 2008.

Crop yield at three farming scales in 2009. Translucent gray bars show average yield for all crops; colored bars show yield by crop and type. The biointensive scale used hand labor only; the market garden scale used hand labor and walk-behind tractors; the small farm scale used any available and appropriate labor assists, including conventional 4-wheeled tractors. Yield (metric tonnes per hectare) represents dry grain weight of field corn and field soy; fresh weight of sweet corn ears, edamame pods, and sweetpotato tubers; and extracted sweet sorghum juice. Each bar is the mean of four replicated research plots. Error bars show standard error of the overall mean.
As in 2008, the biointensive plots required more labor per unit area than the market garden or small farm plots. Small farm plots used the most energy per unit area.

Labor (left) and energy used to farm at three production scales in 2009. Each bar is the mean of four replicated research plots. Error bars show standard error of the mean.
Metabolic (food) energy accounted for all of the energy consumed at the biointensive scale. Fossil fuel energy accounted for most of the energy consumed at the market garden and small farm scales.

Metabolic (red) and fossil energy (black) consumed at three farm scales in 2009. Each bar is the mean of four replicates.

Labor (blue) and energy (red) efficiency at three farm scales in 2009. Each bar is the mean of four replicated research plots.
Although differences between land use efficiency and energy use efficiency at the three scales were modest, differences between labor use efficiency were pronounced. Biointensive plots made the most efficient use of energy and small farm plots made the most efficient use of labor. Market garden plots were intermediate in terms of yield, labor efficiency, and energy efficiency.
The gallery below shows photos taken in the research plots since I last posted about the study in mid-July. Click on an image to expand it and see a more detailed caption.
-
- Crop yield at three farming scales in 2009.
-
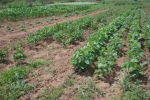
- Small farm soybean, July 13, 2009
-
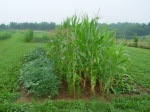
- Biointensive plot, July 22, 2009
-
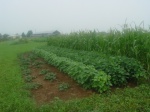
- Market garden plot, July 22, 2009
-
- Small farm, July 22, 2009
-
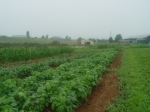
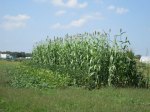
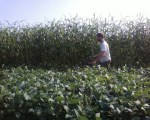
- A view across several plots on August 25, 2009
-
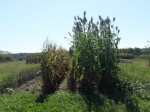
- Biointensive plot, August 25, 2009
-
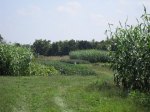
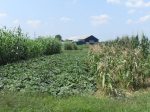
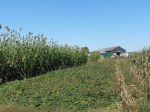
- Market garden and small farm plot, August 25, 2009
-
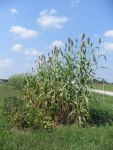
- Market garden plot, August 25, 2009
-
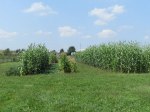
- Small farm plot, August 25, 2009
-
- Soybean harvest, August 25, 2009
-
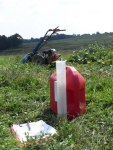
- Record keeping
-
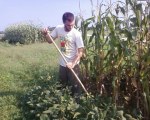
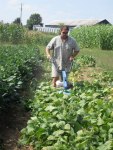
- Hoeing weeds, August 26, 2009
-
- Soybean harvest, August 26, 2009
-
- Biointensive plot, October 5, 2009
-
- Small farm, October 5, 2009
-
- Sweetpotato harvest, October 21, 2009
-
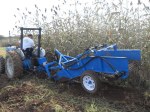
- Sweetpotato harvester, October 21, 2009
-
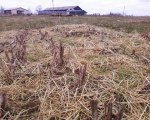
- Winter cover crop establishment, November 19, 2009
-
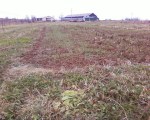
- Winter cover crop, November 19, 2009
-
- Labor and energy efficiency at three farm scales in 2009.
-
- Metabolic and fossil energy consumed at three farm scales in 2009.
-
- Labor and energy used to farm at three production scales in 2009.
All data presented here are preliminary, and were collected during the second year of a four-year study. Thanks to Tony Silvernail, Brian Geier, John Rodgers, Moises Hernandez and the KSU farm crew for making this study possible.


Hi Michael,
Fantastic work. Do the graphs presented on your website reflect this new information (updated metabolic energy inputs)?
When do you intend to publish?
The graphs presented in this post reflect the updated metabolic energy input values, but preliminary analyses presented in older posts have not been revised. This is the beauty and the danger of blogging: Those who follow the blog can learn along with me (just as I learn from those who give me feedback), but we all need to treat the data and analyses as preliminary.
I intend to collect four seasons of field data before submitting manuscripts for publication. 2008 was unusually hot and dry for this region, and 2009 was unusually cool and wet. Given the tremendous variability between just two years of the study, I think we need a few more…
I also expect that those involved with the study will learn something about growing these crops at each of these scales over the course of the study. We need a few years to get good at it.
I have been following your study for a few years now.It caught my attention because you where using a walking tractor from BCS and you probably deal with Joel from Earth Tools there in Kentucky.I have chosen to farm with the BCS using the Berta rotary plow as my primary tillage attachment, and a rototiller and c tine cultivator as my secondary and cultivation attachment.I plan on using strip grazing to harvest my grass and spread manure.I want to Phase in portable pig enclosures to do some tillage as well as manure spreading. I say this because energy conservation is just a good business practice in organic farming. Animal power uses a renewable resource that is raised on my farm to get work done and turn my grass crop into beef/Pork and fat as well as returning fertility back to the soil. I have seen projections that we as a planet will need to grow 50% more food by 2020 than we do today. China and India promise to create a food vacumm planet wide. Local farmers will need to fill the vacumm in there communnitys. Being able to be energy efficient will be important to our ability to be profitable.We call are farm New Life Farm and we are in Fulton, Kansas. We are building this place from raw land. We feel called to do this by God just like someone would be called to the mission field or the Ministry.Your web site is fantastic and I look forward to readingmore of you study”sin the future.
Is there any way to equate human labor and energy? How much energy does it take to fuel a human?
Do the energy numbers equate to fuel used or to (fuel used + (energy required to create the machine/lifetime of machine)*time machine used)?
How much energy does it take to fuel a human? What a great question!
Humans, like other animals get the energy they need to maintain their metabolism from food. We usually measure food energy in Calories, with one Calorie equal to the amount of energy needed to increase the temperature of a kilogram of water by a degree Celsius. A Calorie (note the upper case “C”) can also be called a kilocalorie or food calorie. It equals 4,184 joules.
Hard work burns more Calories than light work. Human physiologists measure the difficulty of work using the “Metabolic Equivalent of Task” (MET) index. Sitting on a couch and watching TV has a MET of about 1. The MET of sprinting can be as high as 18. We categorized farm tasks as “light,” “moderate,” or “intense” and used the following MET values to approximate energy consumption:
Here’s the embarrassing part: The index that I have been using since last year to convert MET to kilojoules per minute turns out to be wrong. Other sources show that a conversion factor of about 5 kilojoules per minute to one MET is appropriate. That’s almost quadruple the rate that I had been using. There’s egg on my face, but I truly appreciate the fact that your comment got me checking my sources.
I have re-done the analysis and revised several graphs to reflect the more accurate conversion factor. Although the general trends don’t change, some of the graphs in this post should look a little different from when you posted your comment two days ago.
Things get more complex. Although humans are animals, we are distinct from other animals in that the food energy we consume is only a small proportion of our total energy consumption. The figures reported in this post just consider food energy as the energy required to fuel a human, but I could have also added in all of our other energy demands… the energy we use to heat our houses, drive our cars etc. A typical human living in the U.S.A. consumes 897 megajoules per day, but a human living in Zambia uses just 69 megajoules per day. If both eat a 2,000 Calorie diet they will use 8.4 megajoules per day to fuel their bodies. How much energy, then does it take to fuel a human?
The nice thing about considering food to be ‘human fuel’ is that results of a study like this are not skewed by the personal choices of the individuals providing the labor, or the amount of energy typically consumed in a society. The fact that this study is being conducted in the United States, not Zambia, won’t affect the reported results. The fact that one of the people providing farm labor lives near the farm and rides a bike to work and another lives far away and drives a car won’t affect the reported results, either, because we’re only looking at energy expended “on the farm” (in the research plots).
The problem is that most of the energy used to maintain humans has little to do with how much we eat or how hard we work, but a lot to do with whether we drive, bike, or walk; how big our houses are; and where we set the thermostat.
This relates to the second part of your question.
The energy numbers reported here reflect fossil fuel energy and metabolic energy used in farming. They do not include the embodied energy used to make the machinery, or maintain the laborers when they aren’t farming. In economic terms, we’re looking at variable energy costs and ignoring fixed costs. The reason for using this approach is that our research plots are quite a bit smaller than typical working farms at each of the scales represented. They have to be to allow us to manage 12 separate “farms” (3 scales x 4 replicates) in a single season. Tasks like attaching implements to a tractor and setting the row spacing end up taking a much larger proportion of our time than they would if we were operating a larger working farm.
My goal is to use this study to estimate variable labor and energy costs so that we can then go back and add in fixed labor and energy costs for more typical farm sizes at each scale. We’re also working with farmer cooperators on commercial farms at several scales to assess their land, labor, and energy use in order to compare their “real world” values with our experimental values.
Thank you for your excellent questions.